 Questo post raccoglie link, video e materiali sull’utilizzo di R Language e delle librerie dedicate ad applicazioni statistiche e di Data Science. È un documento di studio in continuo aggiornamento.
Esempio
#Let's create 2 discrete variables
a=c(1,1,3,4,5,5,1,1,2,3,4,1,3,2,1,1,1,1,1,1,1,3,1,0,2)
b=c(1,2,3,5,5,5,2,1,1,3,4,3,3,4,1,1,4,1,4,2,2,3,0,0,1)
#I count the occurence of each couple of values. Eg : number of time a=1 and b=1, number of time a=1 and b=2 etc...
AA=xyTable(a,b)
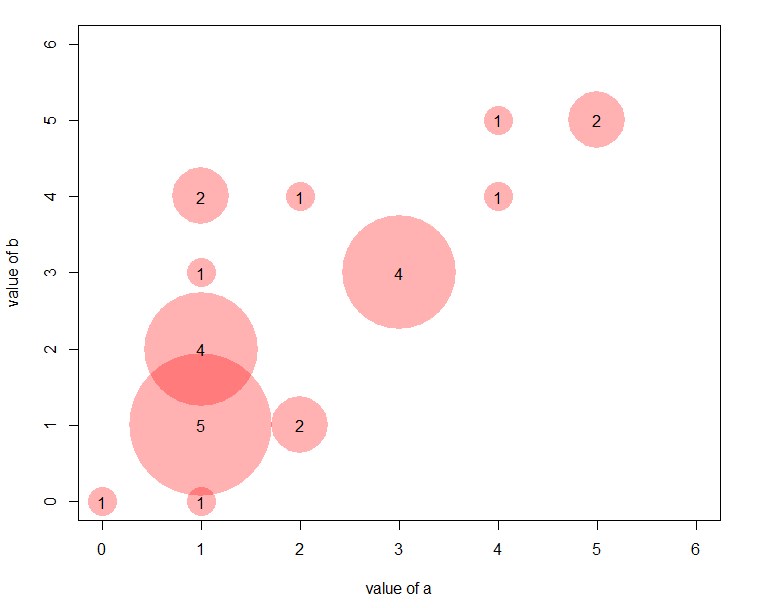
#Now I can plot this ! I represent the dots as big as the couple occurs often
coeff_bigger=4
plot(AA$x , AA$y , cex=AA$number*coeff_bigger , pch=16 , col=rgb(1,0,0,0.3) , xlab= "value of a" , ylab="value of b" , xlim=c(0,6) , ylim=c(0,6) )
text (AA$x , AA$y , AA$number )
#Note : It's easy to make a function that will compute this kind of plot automaticaly :
represent_discrete_variable=function(var1, var2 , coeff_bigger){
AA=xyTable(var1,var2)
plot(AA$x , AA$y , cex=AA$number*coeff_bigger , pch=16 , col="chocolate1" , xlab= "value of a" , ylab="value of b" )
text (AA$x , AA$y , AA$number )
}
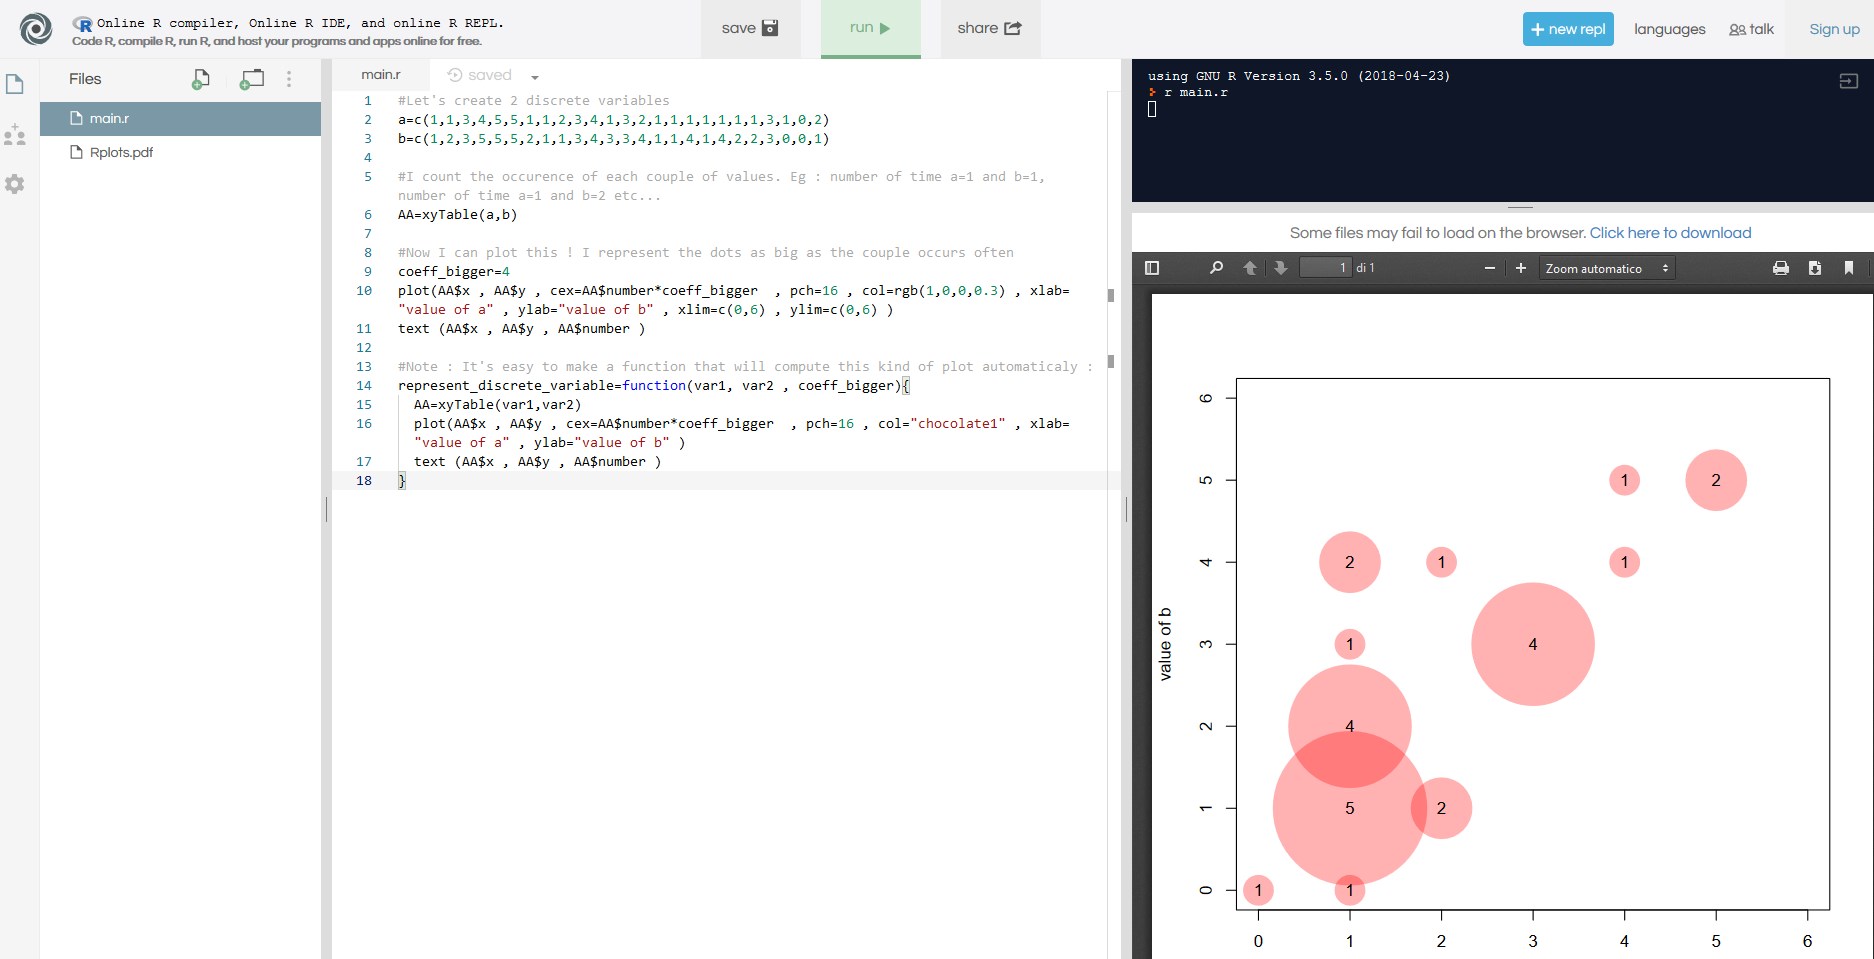
Online R Compiler
On line è possibile sviluppare e compilare il linguaggio R con Repl.it